

Operators have always hunted for demand proxies. Traffic counts, visibility, access, household income, net migration. The lazier version is free-riding on retailer site selection, letting Starbucks or Trader Joe's spend the millions in analytics budget to decide which corner to sign a 10-year lease. Every one of these methods tries to answer the same question: where do people with money want to be? The problem is that the census has a 2-year lag. Never fear, I’ve found a solution.
A 2015 survey conducted for the World Triathlon Corporation found that the average household income of Ironman participants was about $247,000. That’s about $348,000 in today’s dollars. Compared to the average household income in the US of $115,000, the Ironman participants make on average 3x what the average US household makes.
Runners show the same pattern at smaller magnitude. Running USA's surveys of core runners found that over 76% graduated college compared to the national average of 30%.
Not only do people who are consistently active outdoors tend to be both richer and more educated than the average population, the areas where they run, walk, and bike are on average safer, have better infrastructure and are more pleasant.
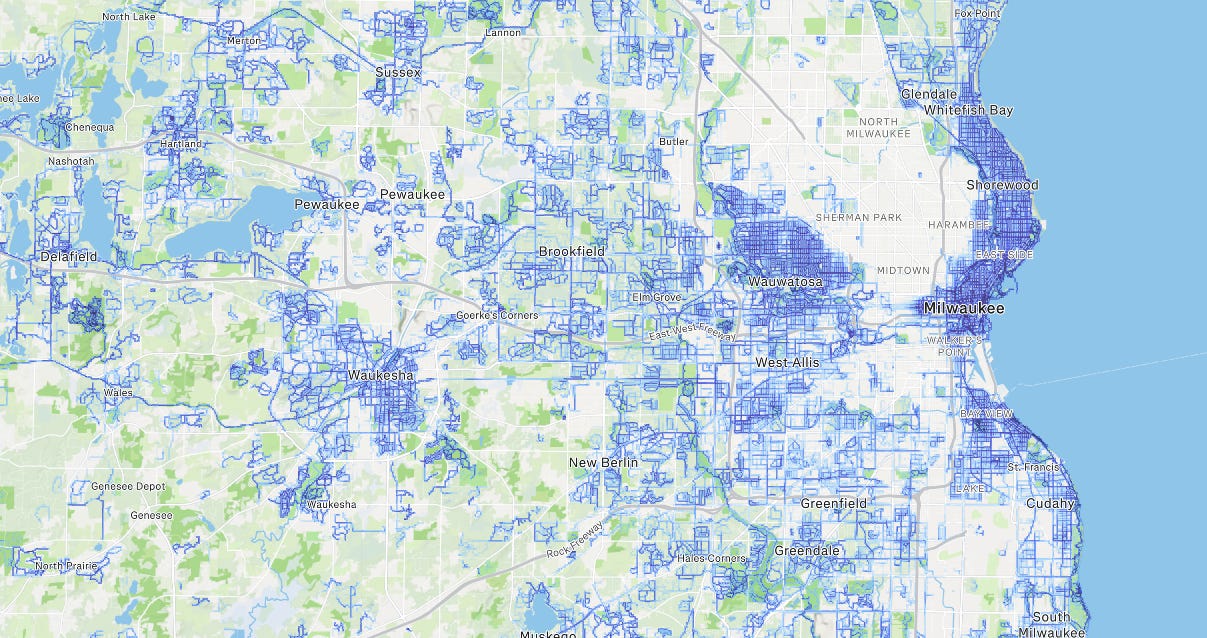
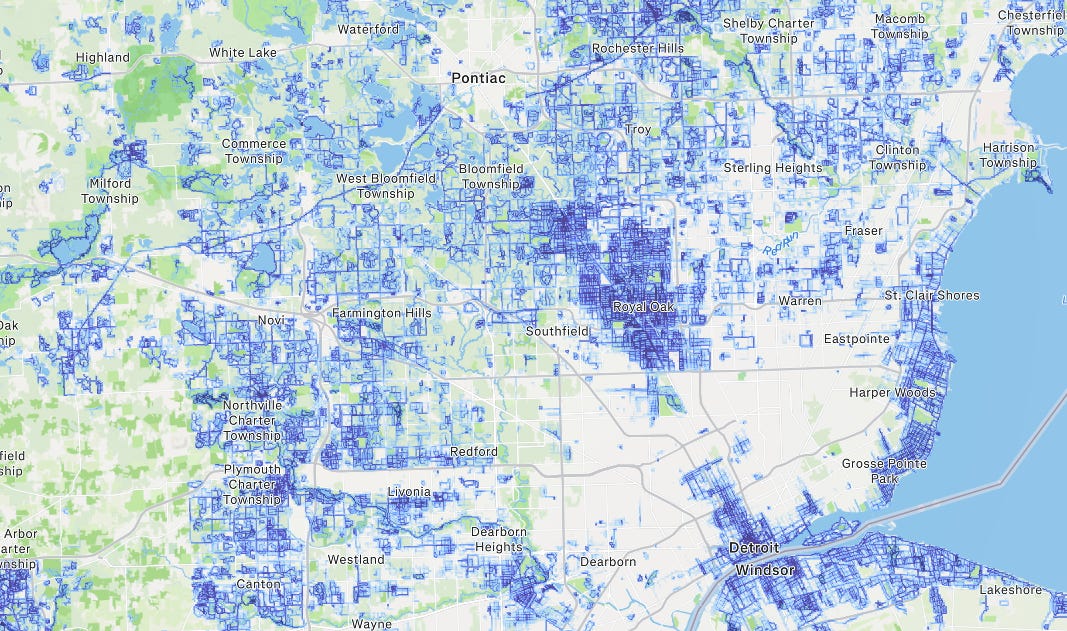
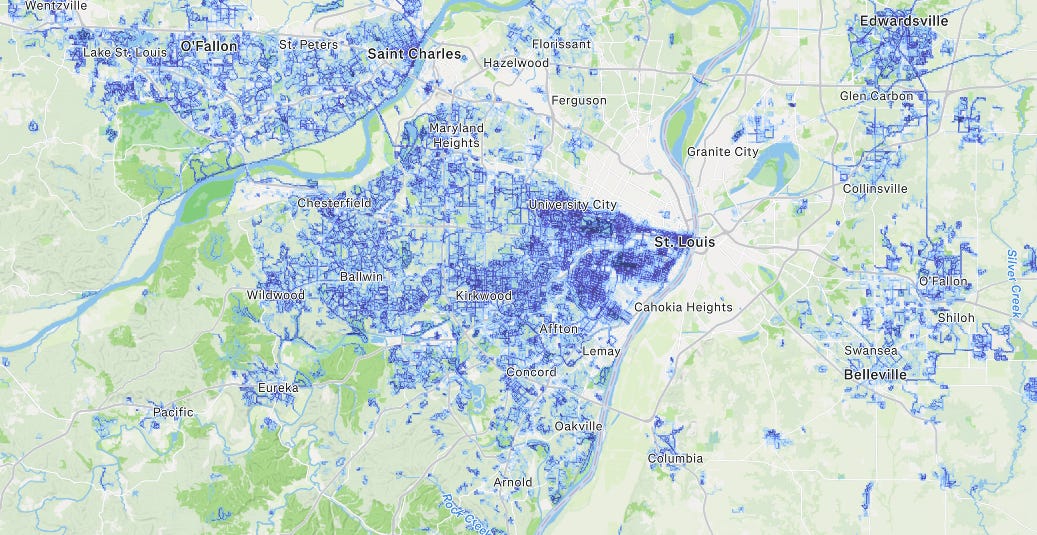
Thanks to Strava the days of sitting in a car with a clicker counting cars driving by is a thing of the past.
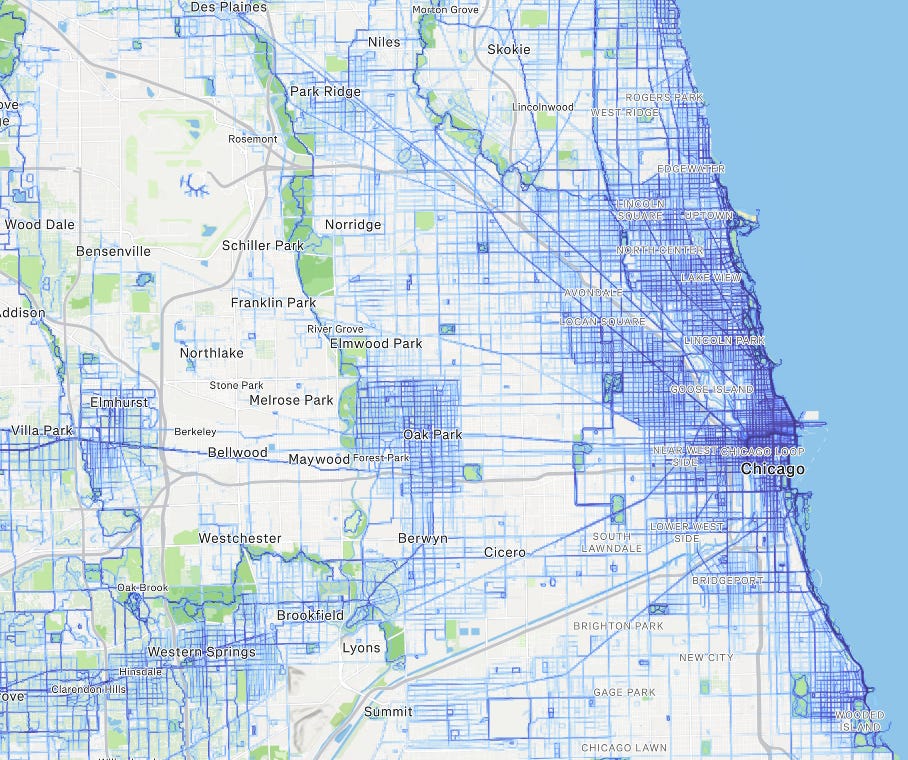
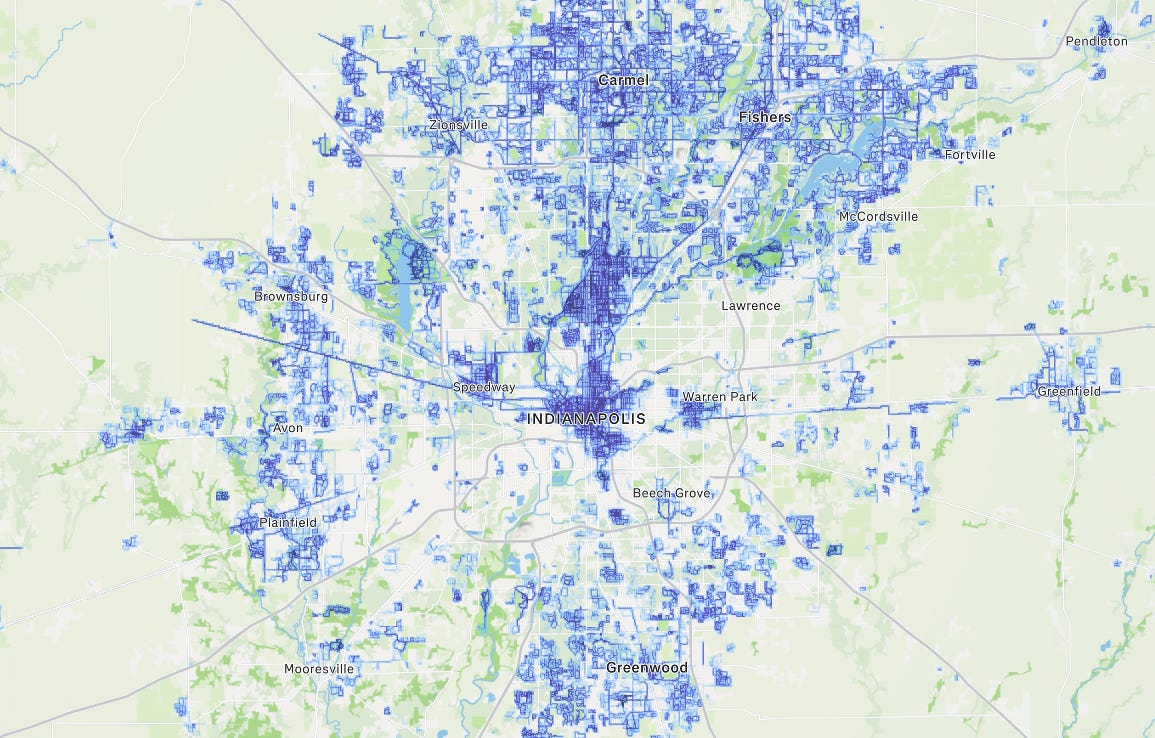
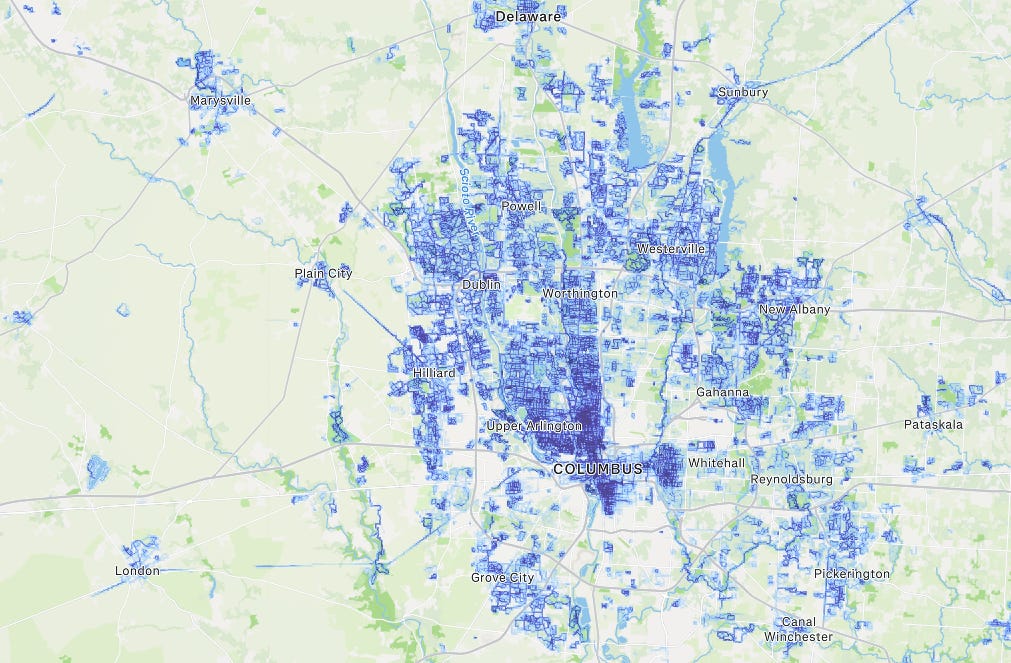
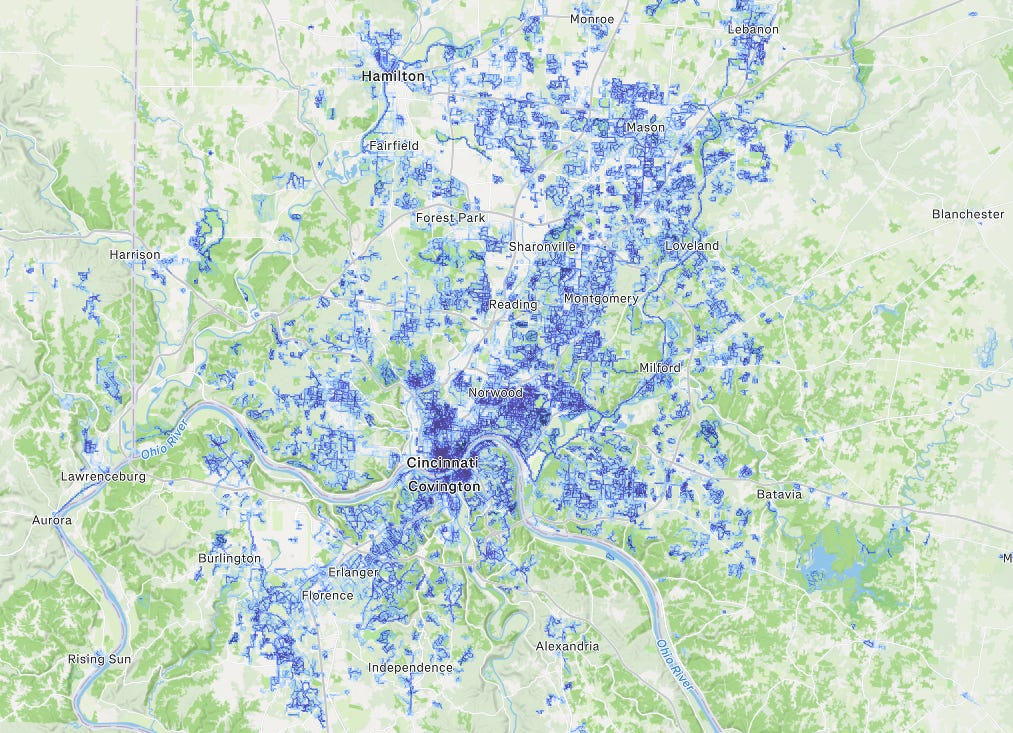
Here are some examples of Midwest cities:
And major Tier 1 Cities:
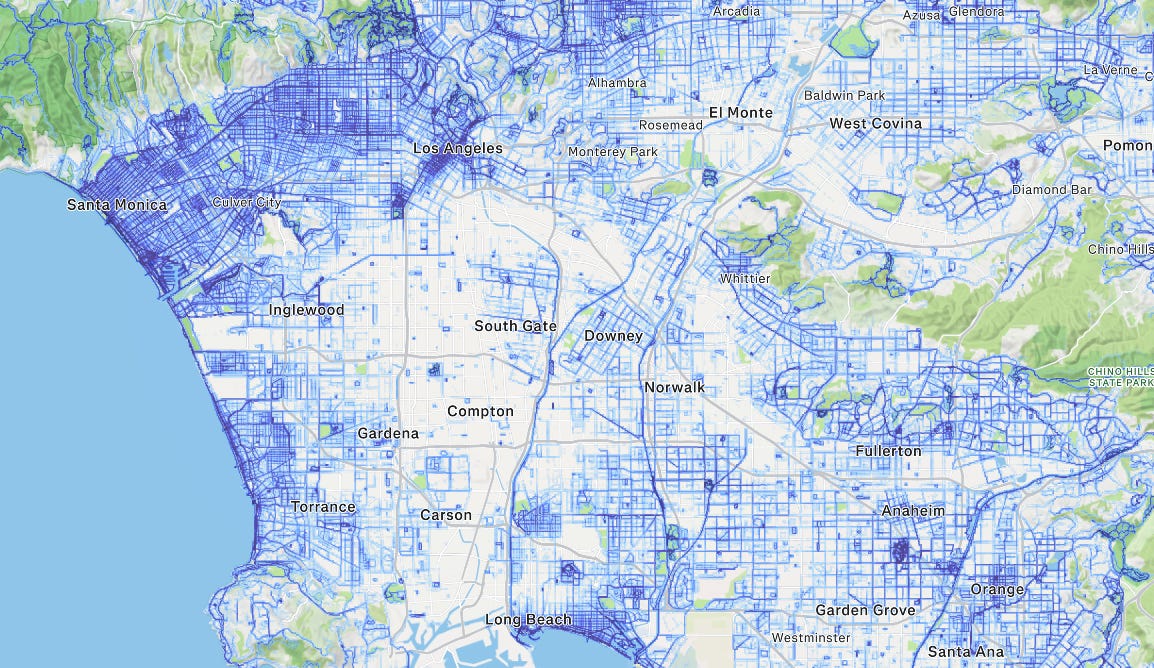
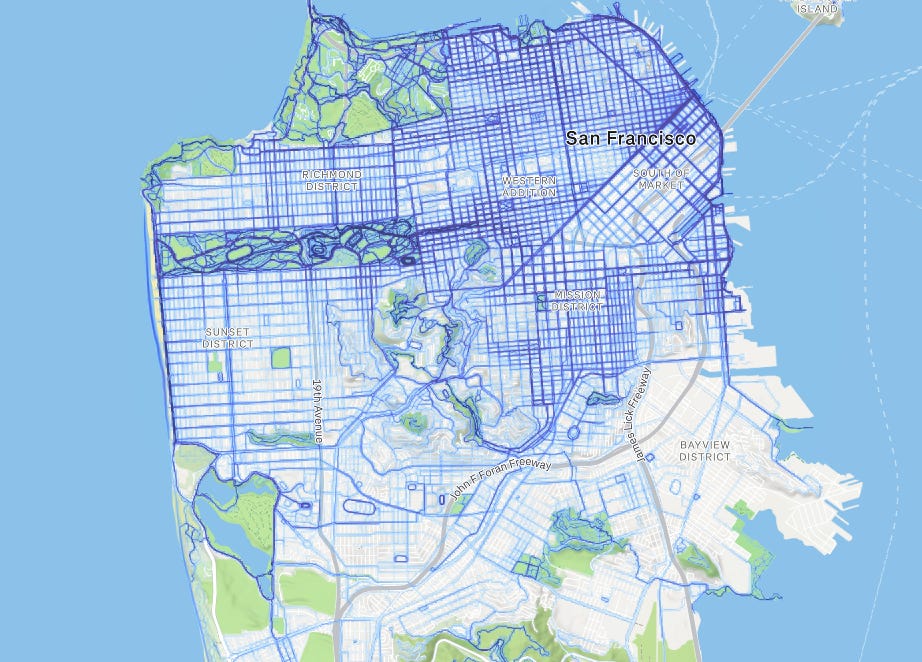
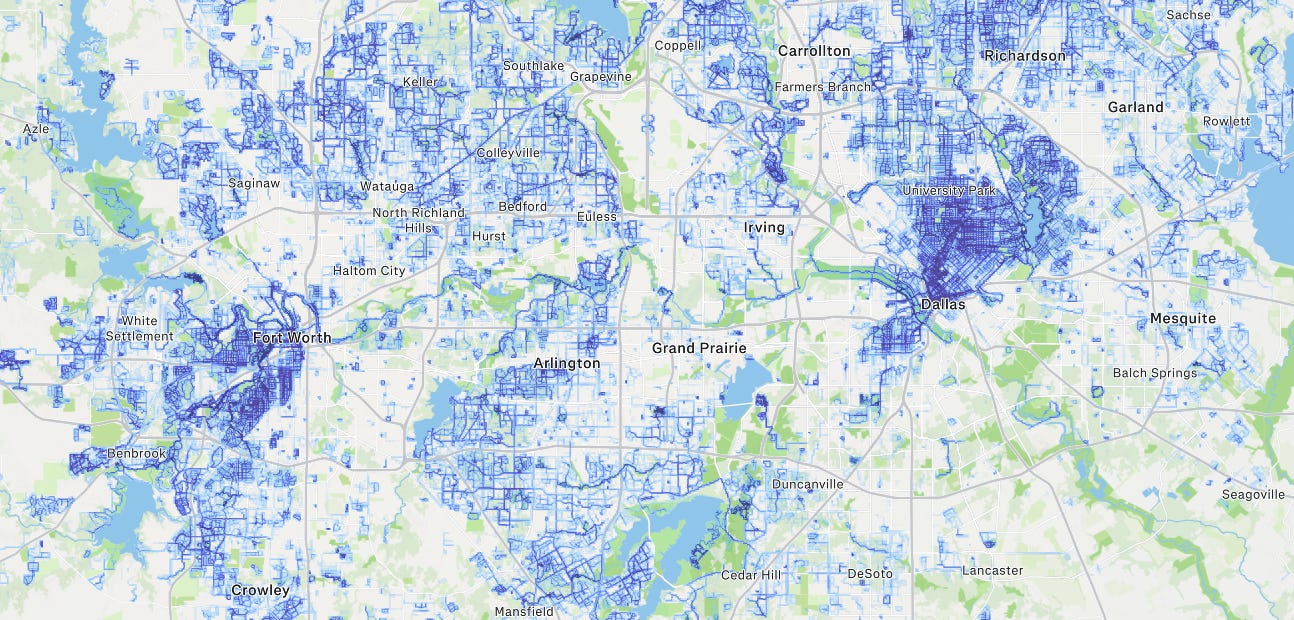
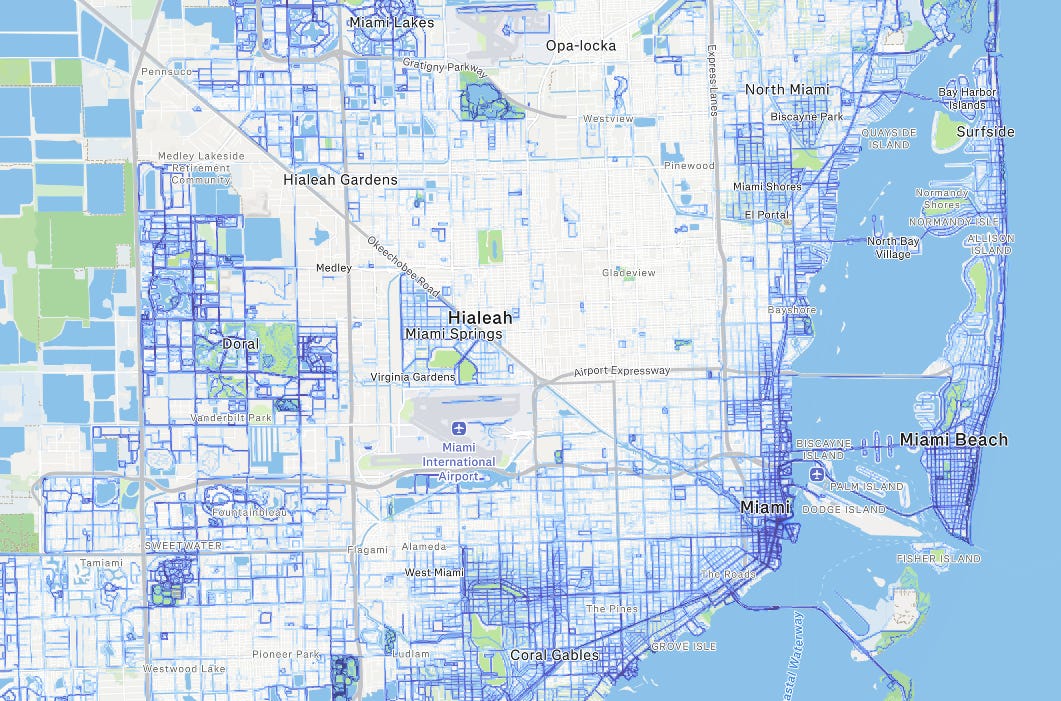
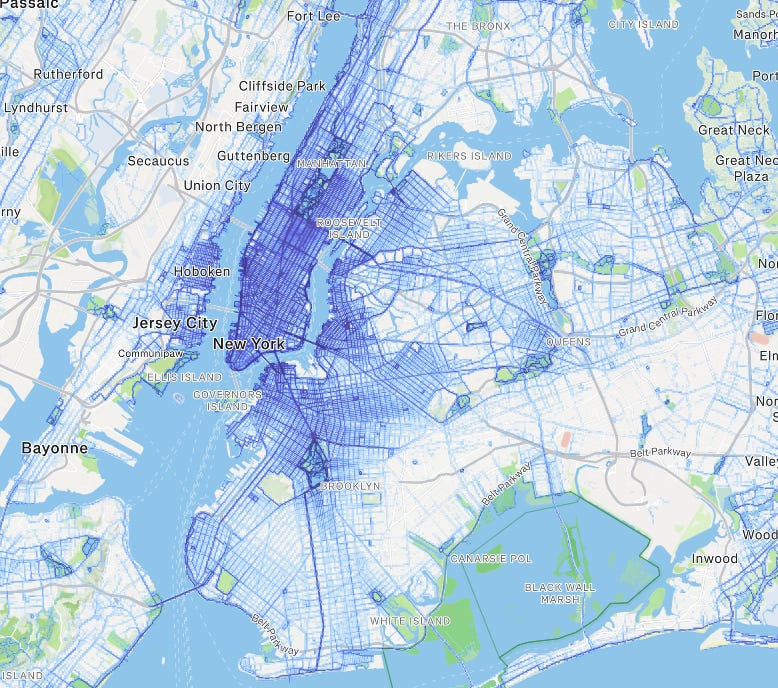
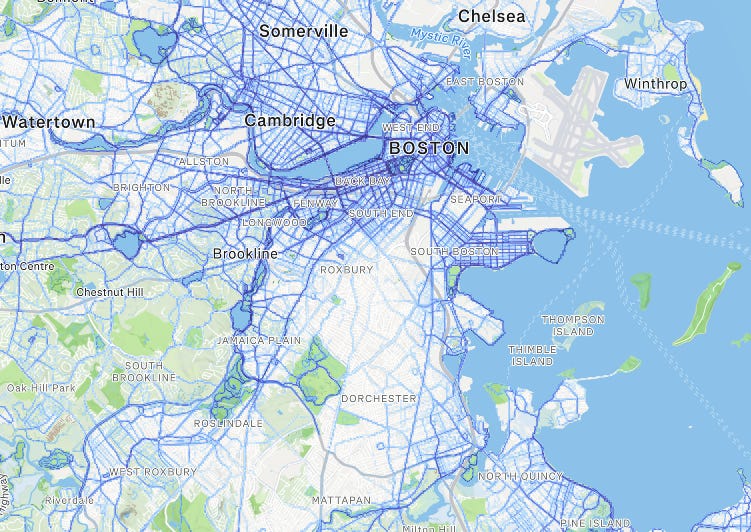
If you’ve spent any time in these cities, it will be obvious to you how accurate the data is. South Side of Chicago, Haughville in Indianapolis, the east side of Columbus, Compton, the Tenderloin, the South Bronx, etc. But what if we took it a step further and overlaid other datasets on top of the Strava map?
Let’s start with Indianapolis.
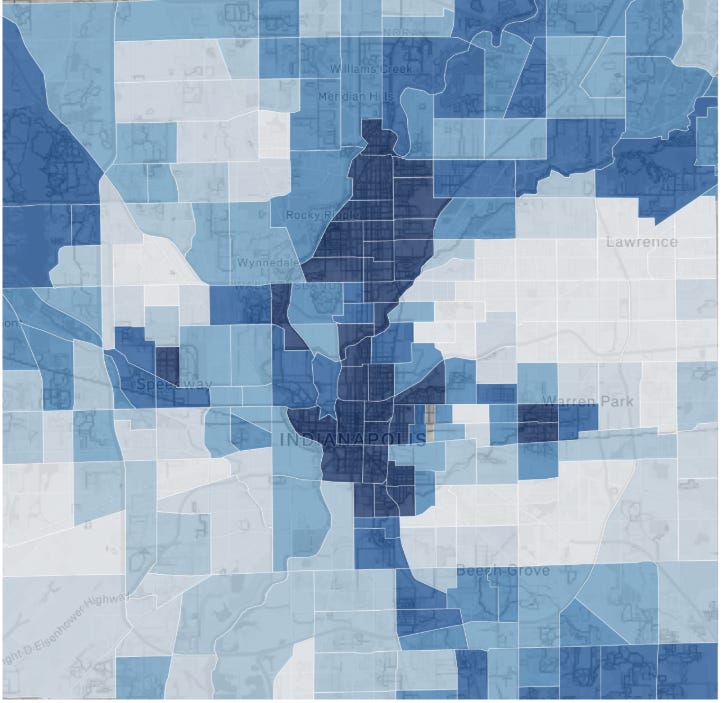
I pulled the intensity out of the Strava screenshot with a script. It reads the blue trail pixels, pins the image to real coordinates using the town labels (the fit landed within about 290 meters, roughly a block), and scores 8,000 grid cells about 320 meters on a side. Those cells get joined to 227 Marion County census tracts and their income, rent, and population from the 2023 ACS. You can do all of this with a free Census API key and an evening of prompting Claude to build the pipeline. Here's what the screenshot turns into:
And here's what the Census Bureau's survey machine says about the same tracts.
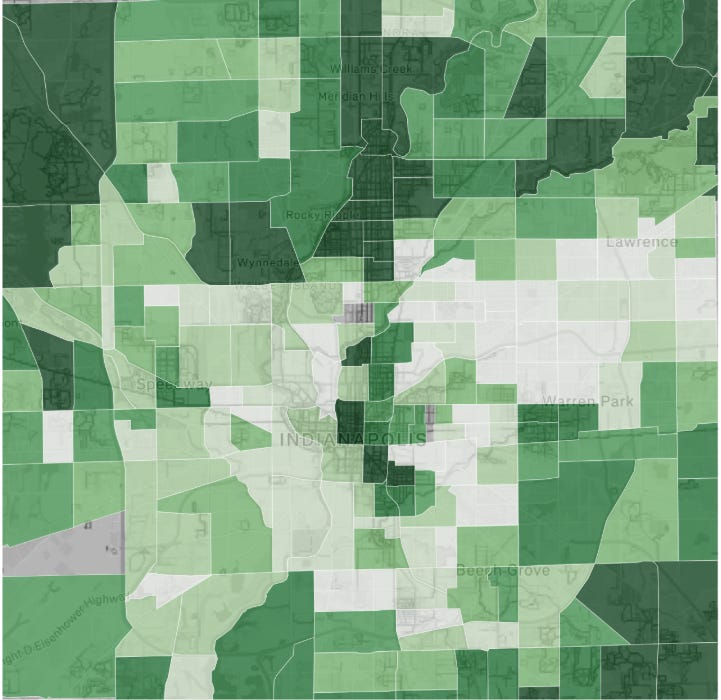
Two things jump out immediately. The north side spine matches: Meridian-Kessler down through Herron-Morton glows in both colors. And the southwest quadrant splits, steady incomes with almost no running. The corners the frame cuts off split even harder. Geist at $145.6K, Williams Creek at $193K, and Traders Point at $148K all rank among the county's 5 largest negative gaps between income and running. Money that drives to the gym leaves no trace here. The map records money that wants sidewalks, street trees, and a trail within a mile. For a multifamily buyer that's a useful filter, because the people who want sidewalks and streets lined with trees are the ones that fill apartment buildings
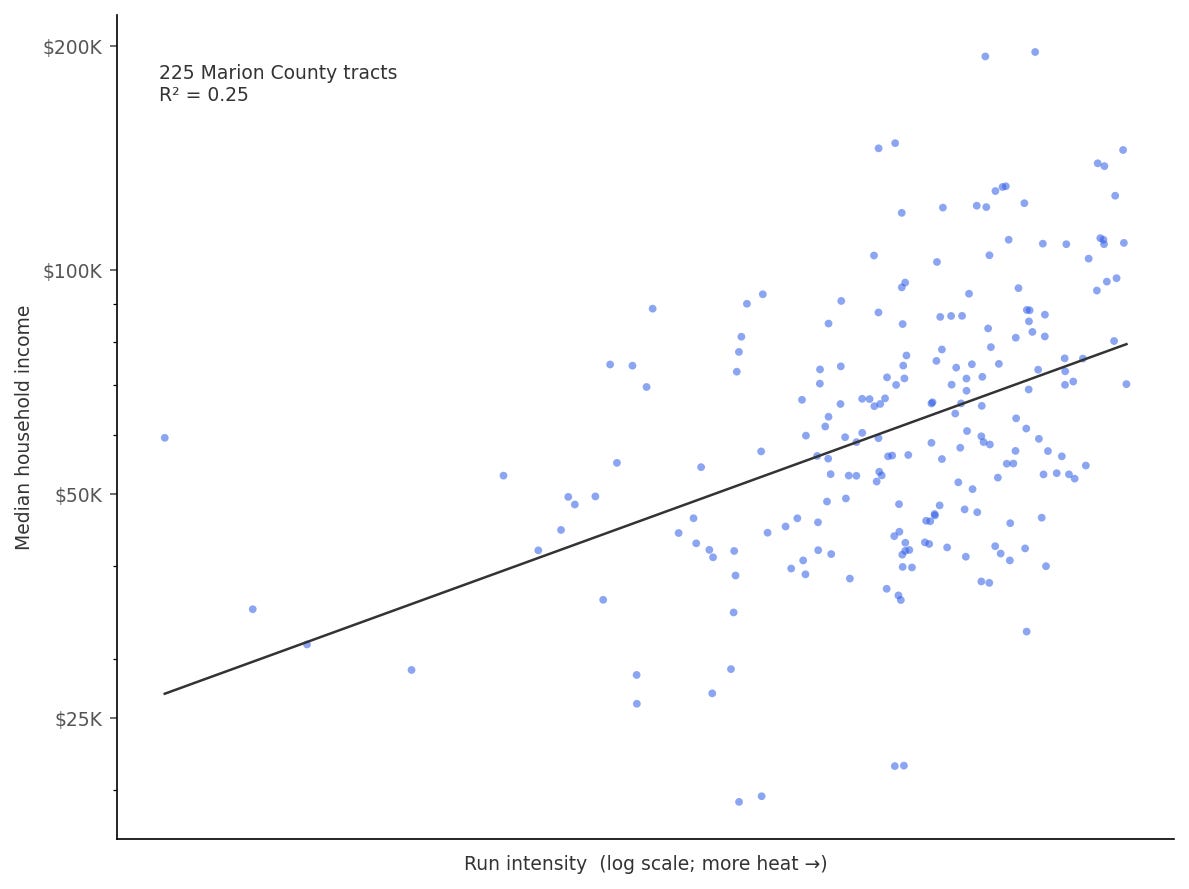
Regressing log income on log run intensity across 225 tracts: R² of 0.25 with a t-statistic of 8.6. One screenshot of a fitness app explains a quarter of the income variation in Marion County. The slope works out to roughly 13% higher median income per doubling of run intensity.
The last map is the one I built this for. If you take each tract's running heat and its income, standardize both, and subtract, you’re left with the locations where there are more runners than the income would suggest.
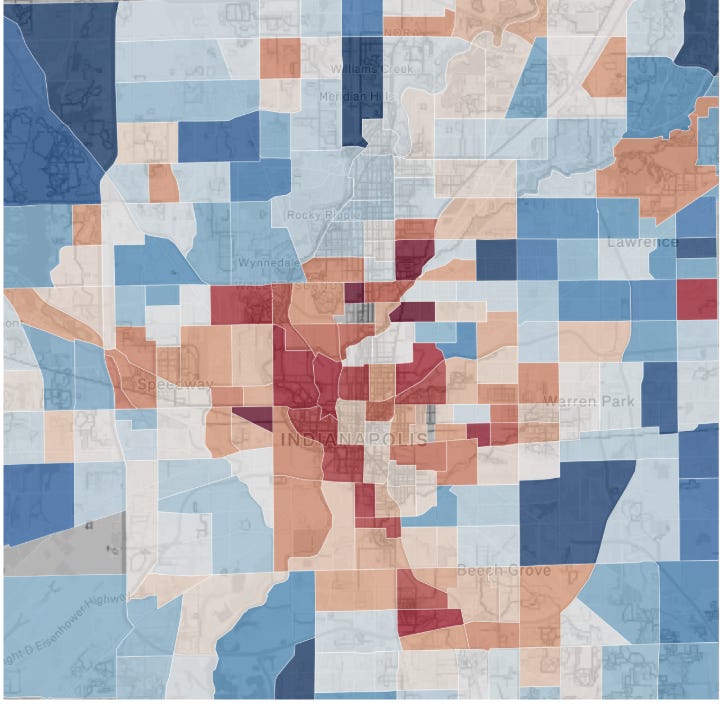
A red tract means the two datasets disagree about the same streets. The census pegs these neighborhoods at $30K to $40K, and pricing mostly follows the census: appraisals, seller expectations, other buyers' screens. Meanwhile the heatmap shows people out running there every morning, which is not what $35K tracts usually look like. Sometimes the explanation is boring. A few of the reddest tracts sit right on the Monon or the Riverside trails, and a busy trail will light up a neighborhood that hasn't changed at all. Or the census is just late. It's a survey with a 2-year lag, and a neighborhood can turn faster than the data that prices it.
I can't tell which story is which from just looking at the map. So the map's real job is a shortlist of corners worth looking deeper at. I plan to recapture this data each quarter and watch which tracts stay red.
So next time you're moving to a new city or looking at investing in an apartment building in one, pull up the Strava heatmap before anything else. It could explain where the best place to be is.


The mismatch map is kind of fun/interesting. Using Strava not to confirm where money already is, but to flag neighborhoods behaving differently from what the census says, feels like a genuinely clever way to decide where to look closer.
this is entirely too much alpha, paywall this before it breaks contain